.png)
Data cleaning is one of the most tedious tasks of a data scientist before building any model, especially when it comes to imputing missing data. Most real-world data have missing observations, which can arise due to various factors.
It’s your role as a data scientist to find how to solve the missing data problem in your dataset, because building a model without missing data imputation can lead to wrong predictions.
There are various ways to impute missing data, from simple techniques such as mean/median imputation to advanced techniques like multiple imputation or KNN imputation. In this article, you will learn about the various libraries you can use for missing data imputation in Python
Key Criteria for Selection
When selecting a library for missing data imputation, ensure you look at the following criteria.
- Ease of use and documentation quality: Ensure the library is not complex, it’s easy to use with well-written documentation. The library explains all the imputation algorithms used, and also the functions for implementing them. This makes it easy to know the right scenario to use a particular imputation method.
- Support for different imputation methods: Some data might warrant simpler methods, while others will need complex imputation methods. You should use libraries that have a wide range of support for various simple and advanced methods. This keeps your workflow lean and simple, and avoids using multiple libraries.
- Integration with popular data science workflows: Some popular Python libraries already support various imputation methods, hence avoiding the need for an external library. Some missing data imputation libraries also make it easy to integrate well with classes and functions from other Python libraries, making it easy to add to your workflow.
- Community support and performance: You want to make sure you are using a library with a lot of help and support online, and it’s also actively maintained. Whenever you get stuck, you can easily reach out for help.
Python Libraries for Missing Data Imputation
Let’s look at some of the libraries you can use for missing data imputation.
1. Pandas
Pandas is one of the most popular libraries among data professionals working with Python. Designed for data wrangling, it comes with various imputation methods, mostly for simple use cases. It’s easy to use, fast, and well-integrated for exploratory data analysis.
Here are some of its built-in methods for missing data imputation:
fillna(): replaces missing values in a dataframe either by the mean, median, or a custom value.interpolate(): fills missing values by interpolating between existing data points, essentially estimating values between known ones.dropna(): removes rows or columns that contain missing (NaN) values.
Examples
Here are some examples demonstrating the above functions.
fillna():df = pd.DataFrame({ 'A': [1, 2, None, 4], 'B': [None, 2, 3, None] }) print("Original DataFrame:") print(df) # Replace NaN with 0 df_filled = df.fillna(0) print("\nAfter fillna(0):") print(df_filled) # Forward fill (propagate last valid value forward) df_ffill = df.fillna(method='ffill') print("\nAfter forward fill:") print(df_ffill)Original DataFrame: A B 0 1.0 NaN 1 2.0 2.0 2 NaN 3.0 3 4.0 NaN After fillna(0): A B 0 1.0 0.0 1 2.0 2.0 2 0.0 3.0 3 4.0 0.0 After forward fill: A B 0 1.0 NaN 1 2.0 2.0 2 2.0 3.0 3 4.0 3.0In the first missing value imputation, the missing values are filled with
0, while in the second missing value imputation, they are filled with the value of the observation in the previouis row.interpolate():import pandas as pd df = pd.DataFrame({ 'A': [1, None, 3, None, 5] }) print("Original DataFrame:") print(df) # Linear interpolation df_interp = df.interpolate() print("\nAfter interpolation:") print(df_interp)Original DataFrame: A 0 1.0 1 NaN 2 3.0 3 NaN 4 5.0 After interpolation: A 0 1.0 1 2.0 2 3.0 3 4.0 4 5.0There
.interpolate()method supports various types of interpolation, but the example above used a linear interpolation whereby the missing values are filled with the assumption that they change at a constant rate between two points, either an increase by 1,2, and so on.dropna():import pandas as pd df = pd.DataFrame({ 'A': [1, None, 3, 4], 'B': [None, 2, None, 4] }) print("Original DataFrame:") print(df) # Drop rows with any NaN values df_drop_any = df.dropna() print("\nAfter dropna() (any NaN):") print(df_drop_any) # Drop columns with any NaN values df_drop_col = df.dropna(axis=1) print("\nAfter dropna(axis=1):") print(df_drop_col)Original DataFrame: A B 0 1.0 NaN 1 NaN 2.0 2 3.0 NaN 3 4.0 4.0 After dropna() (any NaN): A B 3 4.0 4.0 After dropna(axis=1): Empty DataFrame Columns: [] Index: [0, 1, 2, 3]Just as it’s shown in the example above, you can apply
dropna(), either row or column-wise, to drop missing observations from your data.

2. Scikit-learn
Scikit-learn, which is popular for machine learning, also has various classes for handling missing data imputations. This makes it easy to implement missing data imputation in both the train and test data when building your model workflow. Some of the missing imputation classes are:
SimpleImputer: for filling missing values using a simple rule like mean, median, most frequent value, and so on.KNNImputer: fills missing values using the values of nearest neighbors.IterativeImputer: fills missing values by modeling each feature with missing values as a function of the other features.
Examples
SimpleImputer:from sklearn.impute import SimpleImputer import numpy as np import pandas as pd # Original data with missing values data = np.array([[1, 2], [np.nan, 3], [7, np.nan]]) print("Original data:") print(pd.DataFrame(data, columns=["A", "B"])) # Imputer replaces missing values with column mean imputer = SimpleImputer(strategy='mean') imputed_data = imputer.fit_transform(data) print("\nImputed data (SimpleImputer - mean):") print(pd.DataFrame(imputed_data, columns=["A", "B"]))Original data: A B 0 1.0 2.0 1 NaN 3.0 2 7.0 NaN Imputed data (SimpleImputer - mean): A B 0 1.0 2.0 1 4.0 3.0 2 7.0 2.5The above example shows mean imputation, which is mostly used for numerical variables, while the mode is used for categorical variables.
KNNImputer:from sklearn.impute import KNNImputer import numpy as np import pandas as pd data = np.array([[1, 2], [np.nan, 3], [7, 6]]) print("Original data:") print(pd.DataFrame(data, columns=["A", "B"])) imputer = KNNImputer(n_neighbors=2) imputed_data = imputer.fit_transform(data) print("\nImputed data (KNNImputer):") print(pd.DataFrame(imputed_data, columns=["A", "B"]))Original data: A B 0 1.0 2.0 1 NaN 3.0 2 7.0 6.0 Imputed data (KNNImputer): A B 0 1.0 2.0 1 4.0 3.0 2 7.0 6.0In the code above, the
n_neighborsargument in theKNNImputer()class takes the number of nearest neighbors needed to run the missing data imputation.IterativeImputer:from sklearn.experimental import enable_iterative_imputer from sklearn.impute import IterativeImputer import numpy as np import pandas as pd data = np.array([[1, 2], [np.nan, 3], [7, np.nan]]) print("Original data:") print(pd.DataFrame(data, columns=["A", "B"])) imputer = IterativeImputer(max_iter=10, random_state=0) imputed_data = imputer.fit_transform(data) print("\nImputed data (IterativeImputer):") print(pd.DataFrame(imputed_data, columns=["A", "B"]))Original data: A B 0 1.0 2.0 1 NaN 3.0 2 7.0 NaN Imputed data (IterativeImputer): A B 0 1.000000 2.0 1 12.999998 3.0 2 7.000000 2.5

3. Fancyimpute
Fancyimpute is a standalone library for missing-data imputation that includes various algorithms. It also includes popular algorithms, which are already implemented in scikit-learn such as SimpleFill, KNN and IterativeImputer. Other complex algorithms in it are:
SoftImpute:Which implements the Spectral Regularization Algorithms for Learning Large Incomplete Matrices for missing data imputation.IterativeSVD: Which implements the iterative low-rank SVD decomposition for imputing missing data.MatrixFactorization: This uses direct factorization to fill missing data.BiScaler: This uses iterative estimation of row/column means and standard deviations to get a doubly normalized matrix.
Example
Here is a simple example implementing the SoftImpute() class on missing data.
import numpy as np
import pandas as pd
from fancyimpute import SoftImpute

# Sample data with missing values
data = np.array([
    [5, 3, np.nan, 1],
    [4, np.nan, np.nan, 1],
    [1, 1, np.nan, 5],
    [1, np.nan, np.nan, 4],
    [np.nan, 1, 5, 4]
])

print("Original data:")
print(pd.DataFrame(data, columns=["Item1", "Item2", "Item3", "Item4"]))

# SoftImpute: matrix factorization-based imputation
soft_imputer = SoftImpute()
data_imputed = soft_imputer.fit_transform(data)

print("\nImputed data (SoftImpute):")
print(pd.DataFrame(data_imputed, columns=["Item1", "Item2", "Item3", "Item4"]))
Original data:
Item1 Item2 Item3 Item4
0 5.0 3.0 NaN 1.0
1 4.0 NaN NaN 1.0
2 1.0 1.0 NaN 5.0
3 1.0 NaN NaN 4.0
4 NaN 1.0 5.0 4.0
Imputed data (SoftImpute):
Item1 Item2 Item3 Item4
0 5.000000 3.000000 0.270492 1.0
1 4.000000 2.270316 0.120304 1.0
2 1.000000 1.000000 2.475254 5.0
3 1.000000 0.896283 1.941855 4.0
4 0.455978 1.000000 5.000000 4.0
4. Missingno
Missingno is a visualization library for missing observations that allows you to study the pattern of missing observations in your dataset. Through this visualization, you can understand why and how the observations in your data are missing. It’s easy to use and works seamlessly with Pandas. Missingno also supports visualizations such as matrix plot, bar plot, heatmap, and dendogram.
Example
import pandas as pd
import numpy as np
import missingno as msno
import matplotlib.pyplot as plt

# Sample dataset with missing values
data = pd.DataFrame({
    'A': [1, 2, np.nan, 4, 5],
    'B': [np.nan, 2, 3, np.nan, 5],
    'C': [1, np.nan, np.nan, 4, 5],
    'D': [1, 2, 3, 4, 5]
})

print("Original Data:")
print(data)

# Matrix plot
plt.figure(figsize=(6,3))
msno.matrix(data)
plt.show()
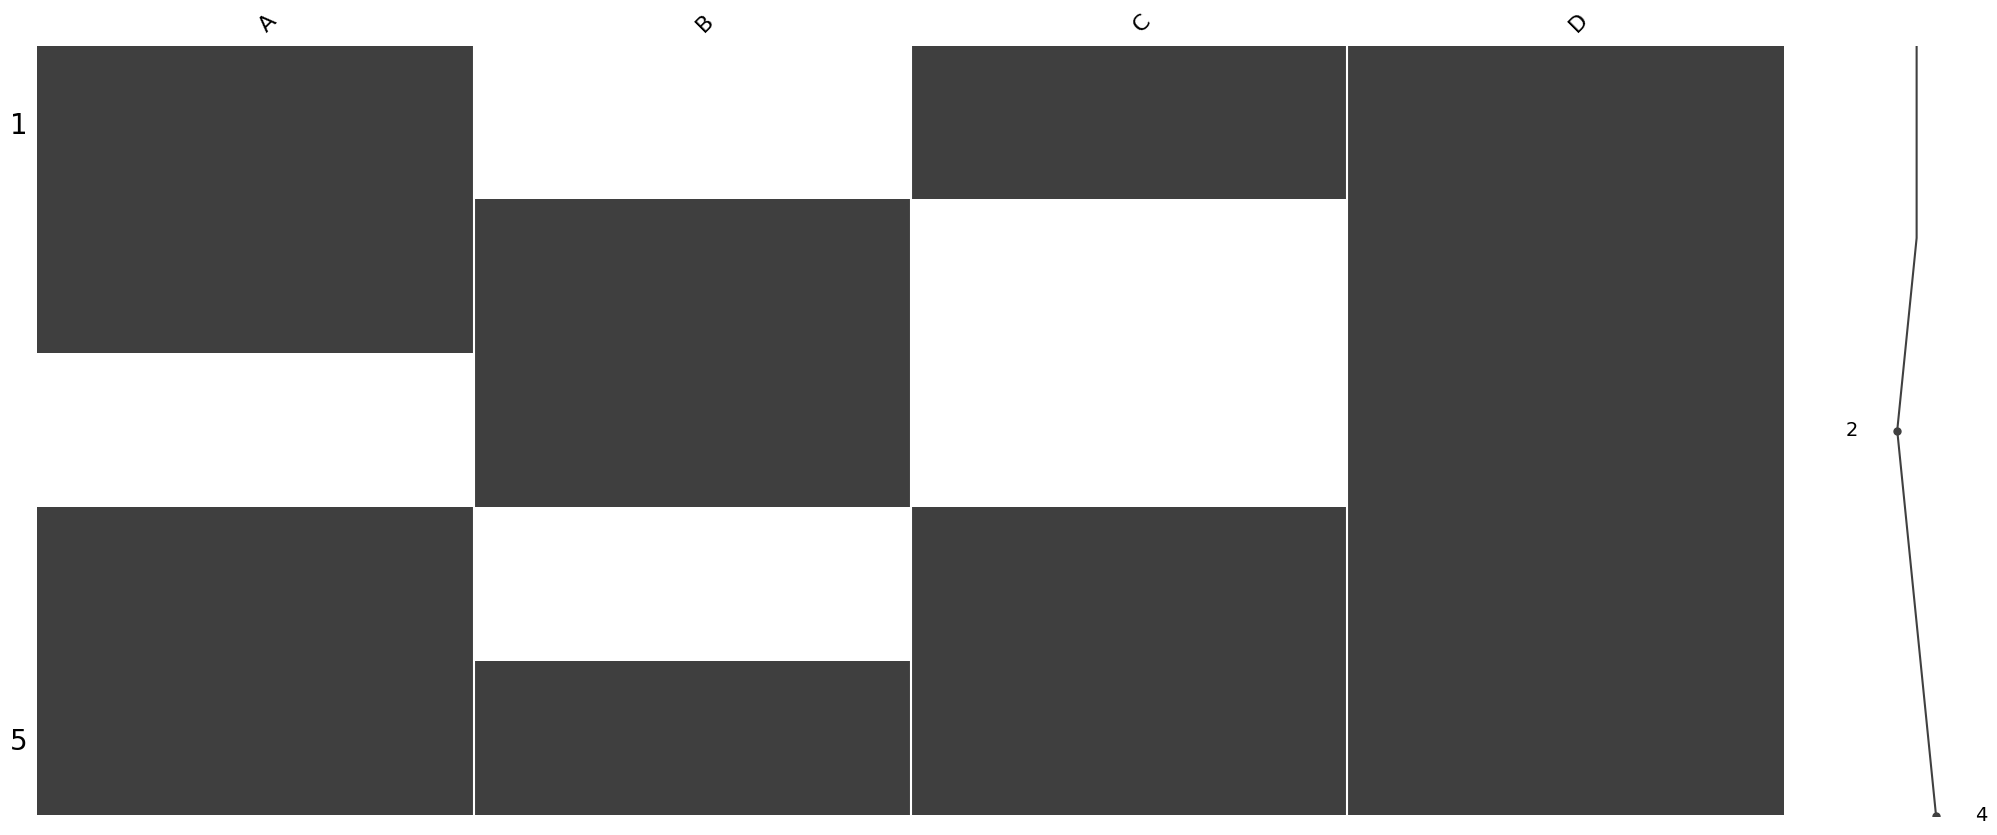
The above example is a matrix plot of missing observations from the dataset. The matrix plot is like a visual display of the data, where the rows are the observations, while the columns are the variables. Shaded regions represent an observation with complete data, while the white regions represent missing data. The curve on the right shows the distribution of the rows with complete and incomplete data.
5. MICEforest
MICEforest is also a Python library for missing data imputation that uses Multiple Imputation by Chained Equations(MICE) through an iterative series of predictive models, based on other variables in the dataset. This method of imputation is better when you are handling complex missing observations in your data or missing data of mixed data types.
Example
import numpy as np
import pandas as pd
import miceforest as mf

# --- Create sample data ---
np.random.seed(42)
data = pd.DataFrame({
    'Age': [25, 30, np.nan, 40, 22, np.nan, 35],
    'Salary': [50000, 60000, 55000, np.nan, 52000, 58000, np.nan],
    'Experience': [1, 3, 2, 5, np.nan, 4, np.nan]
})
print("Original data with missing values:")
print(data)

# --- Create the imputation kernel ---
kernel = mf.ImputationKernel(
    data,
    num_datasets=1,
    random_state=42
)

# --- Run MICE for 3 iterations ---
kernel.mice(3)

# --- Get completed data ---
imputed_data = kernel.complete_data(dataset=0)
print("\nImputed data:")
print(imputed_data)
Original data with missing values:
Age Salary Experience
0 25.0 50000.0 1.0
1 30.0 60000.0 3.0
2 NaN 55000.0 2.0
3 40.0 NaN 5.0
4 22.0 52000.0 NaN
5 NaN 58000.0 4.0
6 35.0 NaN NaN
Imputed data:
Age Salary Experience
0 25.0 50000.0 1.0
1 30.0 60000.0 3.0
2 40.0 55000.0 2.0
3 40.0 50000.0 5.0
4 22.0 52000.0 2.0
5 35.0 58000.0 4.0
6 35.0 55000.0 4.0From the code above, .ImputationKernel() creates a model that imputes each column by taking the number of imputed datasets as arguments, and also the random_state for reproducibility.
The .mice() method runs the iterations based on the number given, which is 3 in our case. It first of all imputes the missing values, then run another model based on the previous imputed data till the number of iterations is fulfilled.

6. Autoimpute
Autoimpute is another Python library that supports a wide range of imputation methods such as univariate, multivariate, and interpolation methods. It works well with scikit-learn and scipy, and also supports missing data visualization using missingno.
Example
**import pandas as pd
from autoimpute.imputations import SingleImputer

# Example data
df = pd.DataFrame({
    "age": [25, None, 30, 22, None],
    "salary": [50000, 60000, None, None, 70000],
    "gender": ["M", "F", "F", None, "M"]
})

imputer = SingleImputer(
    strategy={
        "age": "mean",
        "salary": "median",
        "gender": "mode"  # use mode instead of logistic regression
    }
)

df_imputed = imputer.fit_transform(df)

print(df)
print(df_imputed)**
age salary gender
0 25.0 50000.0 M
1 NaN 60000.0 F
2 30.0 NaN F
3 22.0 NaN None
4 NaN 70000.0 M
age salary gender
0 25.000000 50000.0 M
1 25.666667 60000.0 F
2 30.000000 60000.0 F
3 22.000000 60000.0 F
4 25.666667 70000.0 MThe above is a simple imputation using the SingleImputer class, where it imputes various rows with various measures of spread.

7. H2O.ai
Popularly known for it’s automl capabilities, H2O can also handle missing data observations both in static or streaming data. You can also use some of its methods to impute missing data, where it’s a simple imputation like mean, median, or mode, or advanced imputation techniques. H20 is also great in production. If you have incoming data that can contain missing values, you can use the H2O platform to handle that, ensuring that your ML model does not break and give wrong predictions in production.

8. TensorFlow Data Validation (TFDV)
TensorFlow Data Validation (TFDV) is a powerful library designed to analyze, validate, and monitor data used in machine learning (ML) pipelines. It is useful in production environments, where data consistency and quality are critical for maintaining reliable model performance.
TFDV allows you to detect issues such as missing features, data drift, and anomalies that may occur as new data flows into your production pipeline. If a particular observation or feature is missing, TFDV can flag it and help you decide whether to impute, correct, or exclude it based on your defined schema.

9. Datawig (Amazon)
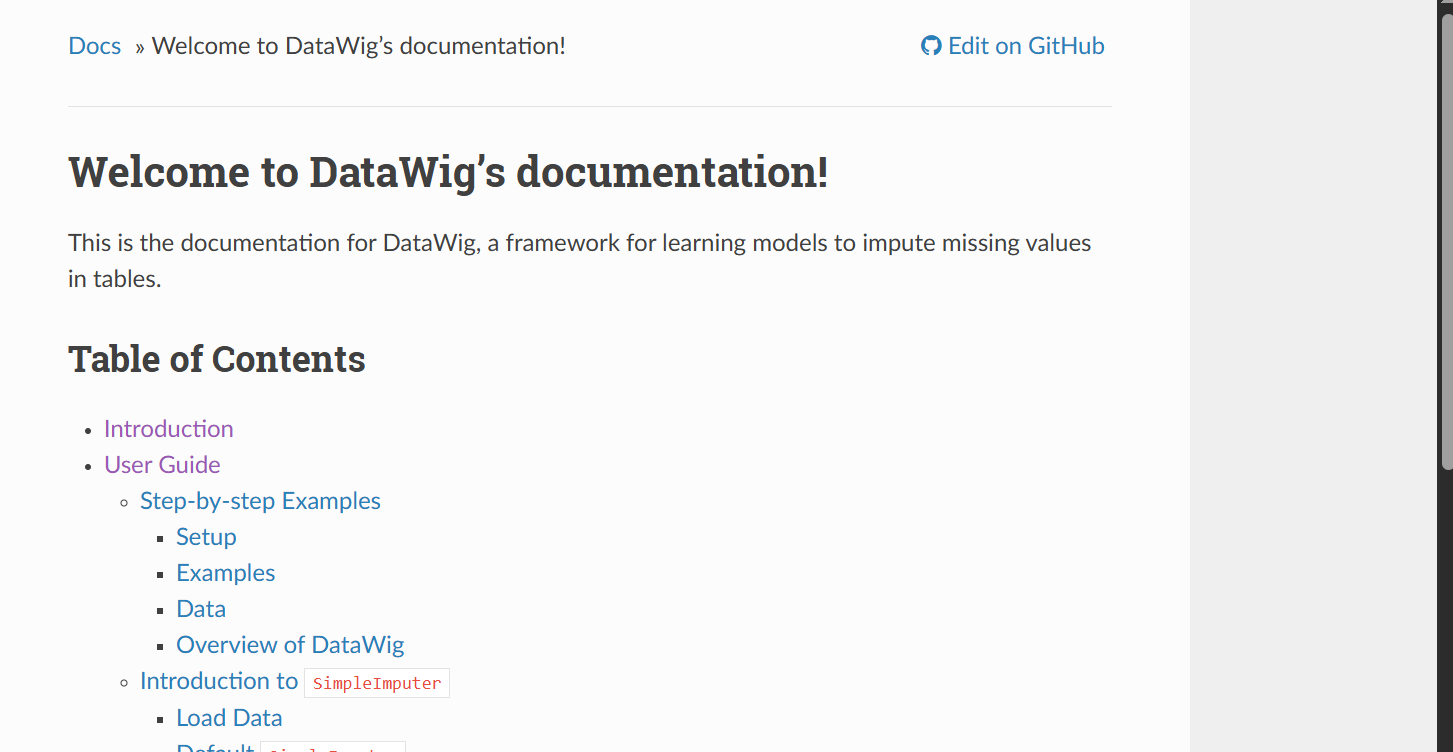
Datawig is an open-source library developed by Amazon for data imputation. It offers advanced data imputation by learning from other variables. While offering complex missing data imputation, it’s easy to use and not verbose. It also handles both numerical and categorical missing data very well. Datawig uses various deep-learning-based imputation methods to fill missing data.

Comparison Table
You might wonder, with all the options above, which is the best for your use case. Here is a table summarizing the above Python libraries and what they are best for.
| Library | Approach | Best For | Learning curve |
|---|---|---|---|
| Pandas | Simple | Small data with few missing observations. | Low |
| Scikit-learn | Statistical/ML | Integration of missing data imputations into ML pipelines. | Low |
| Fancyimpute | Advanced | High-dimensional data | Low |
| Missingno | Visualization | Missing data visualization and diagnostics. | Low |
| MICEforest | Random Forest | Robust imputation | Low |
| Autoimpute | Statistical | Reproducibility | Low |
| H2O.ai | ML/AutoML | Big data | High |
| TFDV | Production-scale | ML pipelines | High |
| Datawig | Deep Learning | Complex patterns | High |
Best Practices for Missing Data Imputation
When imputing missing data, here are some best practices you should adhere to:
- Always visualize missingness patterns first: Visualizing missing data lets you see the nature of missing observations in your data. Through the visualizations, you can know the kind of missing data you are dealing with and the relationship of the missing data with other variables. This lets you know the kind of imputation technique to go for.
- Avoid blind imputation without domain knowledge: Don’t just drop missing data or impute data anyhow; try to understand why it’s missing. Some data have to be missing, for example, if in a survey given to both men and women, and there is a question regarding pregnancy or menstruation, it’s obvious that for males, those questions will contain missing values. This kind of missing value is understandable, and imputing it will mean the male has been pregnant or menstruating, which is not possible.
- Compare multiple methods for robustness: Test various imputation methods; some imputation methods are more robust than others. Also, it’s advisable that you go for multiple imputations to get accurate results.
- Validate imputation impact on model performance: If possible, try to run your model with and without missing values imputed, which lets you see the impact of the missing values on the model and if they are worth imputing.
Conclusion
Choosing the right imputation library is important; some libraries offer more advanced imputation methods, while others offer integration into production ML systems. Your choice depends on your use case.
You can combine these libraries to achieve better results for example, you can use Missingno with Scikit-learn, where Missingno will handle diagnostics of missing observations, and you use Scikit-learn’s diverse set of missing values imputation algorithms for imputation.
In the future, we hope to see the ease in imputing missing data with the rise of AI-based imputation, and also causal inference methods.
Need Help with Data? Let’s Make It Simple.
At LearnData.xyz, we’re here to help you solve tough data challenges and make sense of your numbers. Whether you need custom data science solutions or hands-on training to upskill your team, we’ve got your back.
📧 Shoot us an email at admin@learndata.xyz—let’s chat about how we can help you make smarter decisions with your data.